
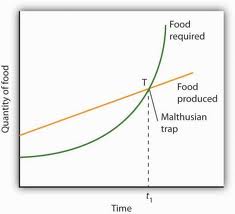
 Today we discussed Malthusian theory. Thomas Malthus in 1798 postulated a theory that population, which grows exponentially/geometrically (see the curved line on the graph), would outpace food production, which grew in a linear/ arithmetic fashion (see the straight line on the graph). Unfortunately his theory did not predict the innovations within the industrial and 2nd agricultural revolutions which made food production much more efficient and allowed food production to outpace population growth. Neo-Malthusians, which have adopted Malthus' theory to more modern times, say the theory is still valid and point to LDC's in stage 2 of the Demographic Transition model as evidence since they have outgrown their food resources. Other theorists: Karl Marx said it is not about just outpacing food, it is about the unequal distribution of food. He says that there is plenty as long as we distribute it properly. Boserup's theory says that we must increase our use of subsistence farming, which essentially means that more of us must grow our own food. Also, it should be mentioned that birth rates since the 1980's have been in decline through much of the world due mainly to increased development (leads to greater education for women) and the distribution and availability of contraceptives worldwide.
1 Comment
 Today we went over the World Population Data Sheet and you should some general trends in the data. In general, LDC's have higher birth rates and death rates and MDC's have declining birth rates and death rates. Make sure you know at least the top 3 populated countries (China @ 1.35 billion, India @1.26 billion, and the US @ 314 million) and that the World population is at 7.058 billion.
 Today we took the vocab test for chapter 2 and started working on the World Population data sheet.
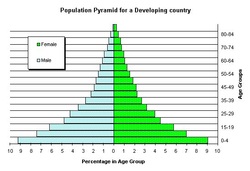 Today we continued our discussion on population pyramids and compared them to the demographic transition model. A developing nation can be found in stage 2 and 3 of the DTM and more developed countries are in stage 4. There is a proposed stage 5 of the model in which a population's CBR is lower than its CDR and indicates the population is shrinking. The population pyramid on the left is typical of a stage 2 developing country, where the population has a wide base (very large young population) and a small middle and very small old population (indicate low life
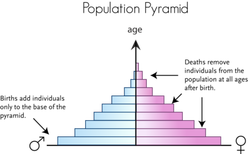 Today we introduce population pyramids after the vocab quiz for chapter 2. Population pyramids are bar charts that show the age distribution for males and females in a particular place. The structure of the pyramid can tell us a lot about the makeup of the population and potential problems the place may face due to the way their population is structured.
 Today we discussed the new grading policies and looked at section 2.3, the Demographic transition model (DTM). Make sure you know why birth and death rates are high at the beginning and low at the end. Make sure you know why in stage two, births are high but deaths decrease. Make sure you know why in stage 3, births decrease and why deaths are still low. In addition be able to provide specific example of at least two countries for each stage of the DTM.
|
 RSS Feed
Photo from D Johnston
